
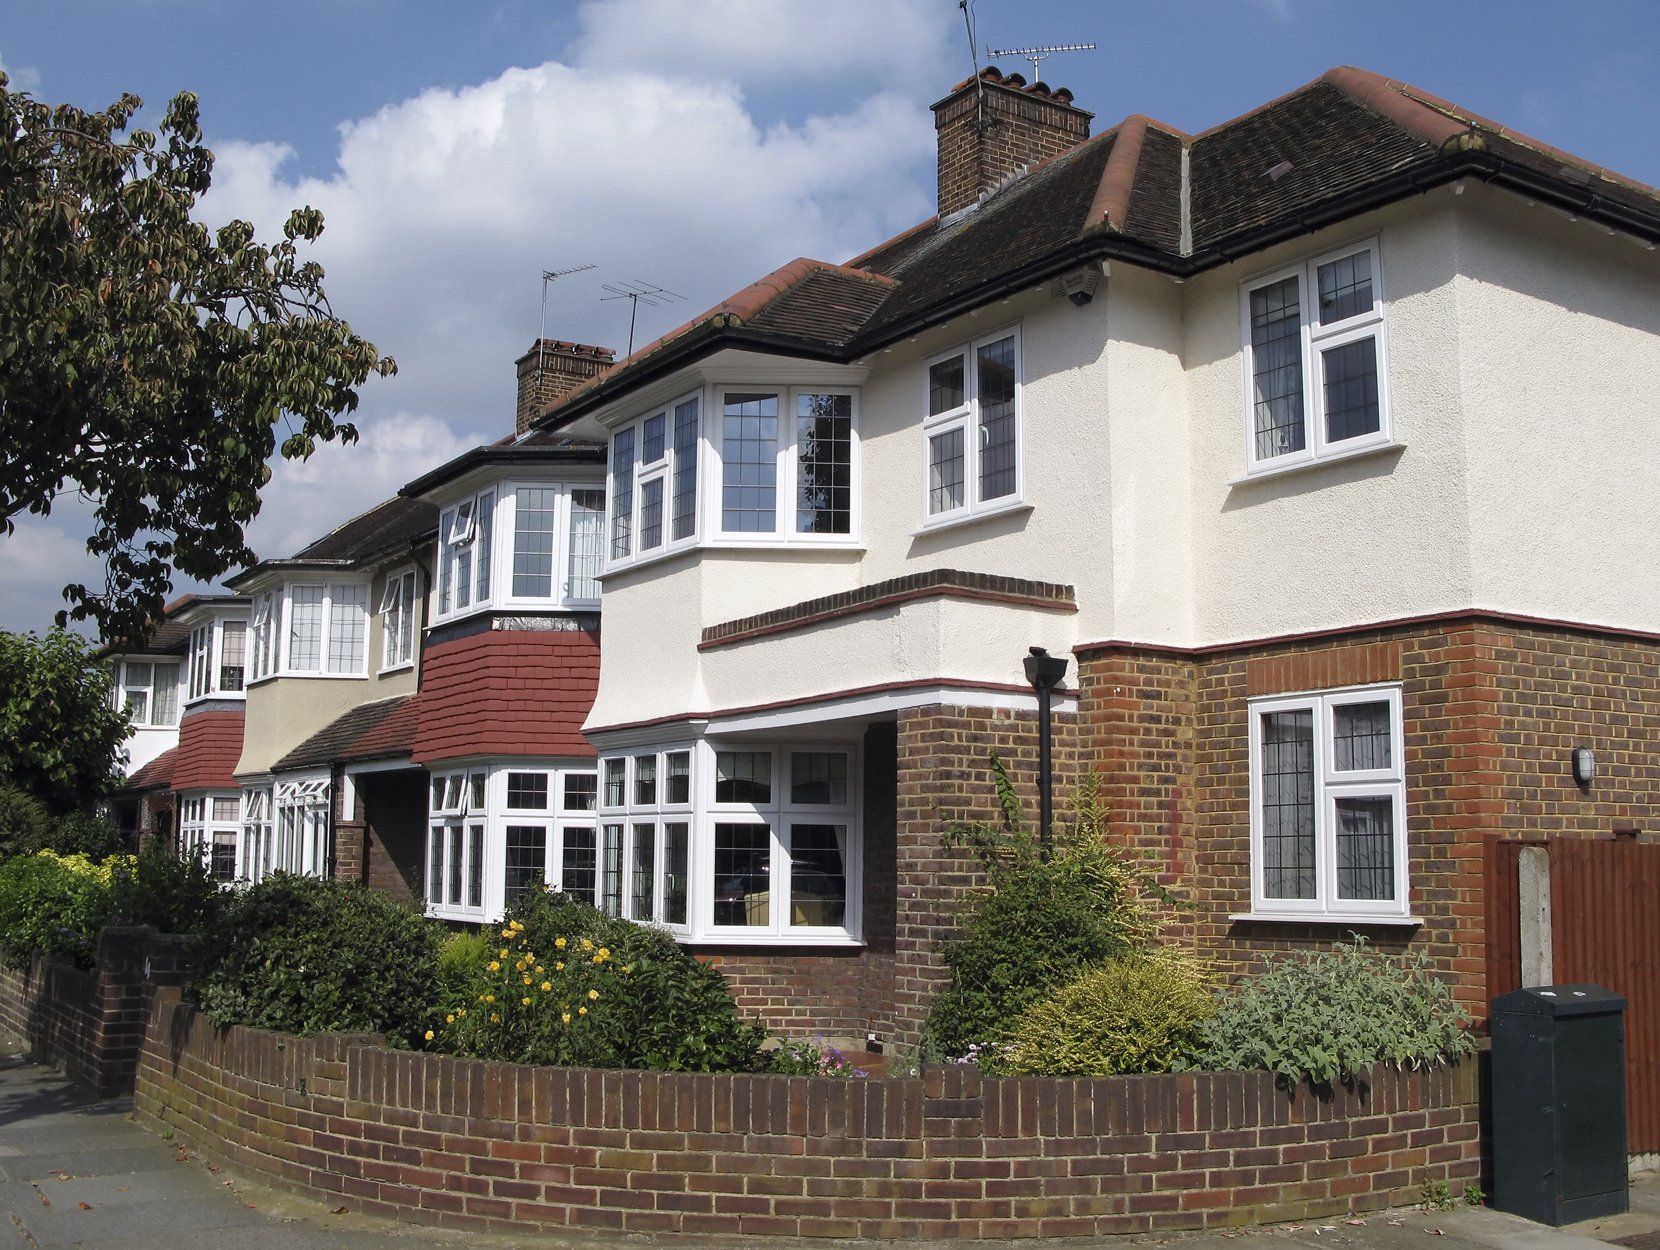
Visits to shopping centres down by a quarter compared with Feb 2020
William Wagstaff • 14 December 2020
Travelling for retail or recreation at 74% of its Feb 2020 baseline.
We find Google's Community Mobility reports fascinating. They use (opted in) location data from mobile phones to plot where people have gone. The reports look at visits to retail, transport hubs, supermarkets and places of work and compares these with a median value from Jan 3 to Feb 6 2020 (the Feb baseline) to calculate the percentage drop in visits.
The graphic shows the drop in visits to retail and recreation (shopping centres, cafes, museums and the like) from the baseline to 7th December 2020.
The darker the shading the nearer the number of visits is to the Feb baseline. The lighter the shading the bigger the drop off.
Three of the biggests drop offs are in Scotland. Stirling and Glasgow areas have seen 50% drop off in what should be a very busy time. London is down 38% from the baseline. Greater Manchester 28%. Kent (also in tier 3) is only down 26%.
If you want normality go to the Isle of Wight. It's currently running at 90% of its Feb baseline.

Housing affordability is getting worse and there is a need to balance policies relating to demand with those addressing supply.

After yet another market research conference calls for great emphasis on storytelling, we discuss why researchers find it so difficult and what can be done to get better at it.

A university degree doesn't necessarily make you a better researcher but it does help. We have a look at whether a degree should be a requirement for market research roles.

Given the huge amount of brand insight that can be derived by applying techniques such as text analytics to existing data, we ask whether the end of the survey for brand metrics is in sight?

With the insights industry creaking under poor quality data, generative AI adds to the mix by creating convincing synthetic respondents. How should we treat these fascinating fakers?

Do tech people know more about market research than social scientists? In this article we discuss whether big tech is taking over the insights industry and what role is there for human researchers.

Does curating a personal brand make a difference? In this article, I consider my own lack of brand image and reflect on what might have been.

In an effort to improve quality, the market research industry's current focus is on survey length and question engagement. This overlooks a more fundamental issue: respondent authenticity.

The true value of review sites lies in going beyond the stars and analysing what reviewers are actually saying.
Predictive analytics is reshaping brand insights by moving beyond descriptive dashboards to proactive decision-making